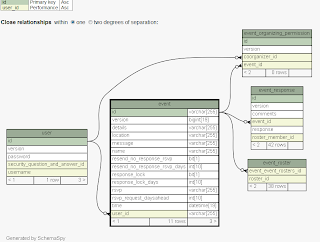
There shouldn't be any argument that understanding data in your application is important. One tool I have found incredibly valuable in helping me understand database relationships is ShemaSpy. There was already a Hudson job set up on project when I rolled in, so I wouldn't credit myself with discovering SchemaSpy(I guess the credit should go to Paul Mazak), but assuming you already have JAVA installed on your Windows machine to set up SchemaSpy:
1. Download the latest SchemaSpy jar:
http://sourceforge.net/projects/schemaspy/files/
In my case the jar was schemaSpy_5.0.0.jar I saved it as C:\SchemaSpy\schemaSpy_5.0.0.jar
2. Download the latest version of graphviz
http://www.graphviz.org/Download.php
It looks like this one only comes with a msi installer. I'm pretty sure they had a binary at one point, but no longer the case, I guess..
In my case I installed GraphViz to C:\GraphViz_2.28
3. Ensure GraphViz was added to the PATH Environment System variable
In my case the msi installer did append C:\Graphviz_2.28\bin to the PATH
5. Copy to the SchemaSpy directory any jars with the driver that you'd need to connect to your database of choice
In my case since I am going against MySQL so I placed the mysql-connector-java-5.1.13-bin.jar in C:\SchemaSpy
6. Run SchemaSpy
Open command prompt and cd to the directory of the SchemaSpy jar
Run:
java -jar schemaSpy_5.0.0.jar -dp mysql-connector-java-5.1.13-bin.jar -gv "C:\Graphviz_2.28" -hq -t mysql -db my_database_name -host localhost -u my_username -p my_password -o C:\SchemaSpy
7. Open and enjoy the generated graphics
Go to the directory you specified with the -o option of the previous command.
There should be an index.html file there, click on it and ...voila you have graphical representation of your database and its relationships.
Hope this helps someone!
